GPU prices, October 2026
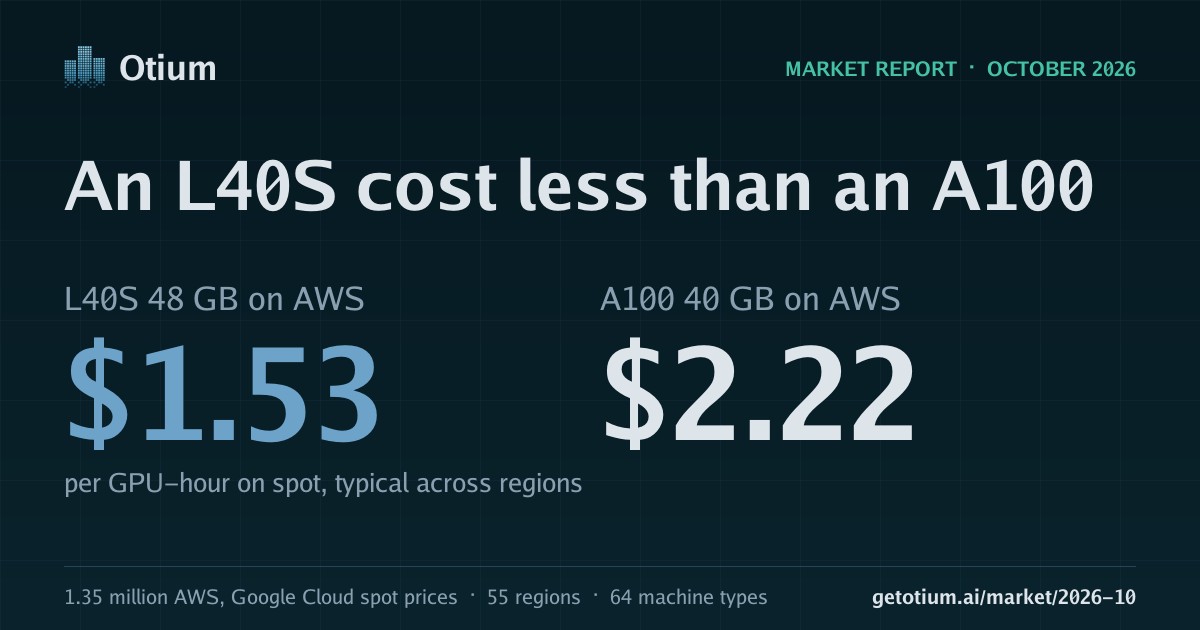
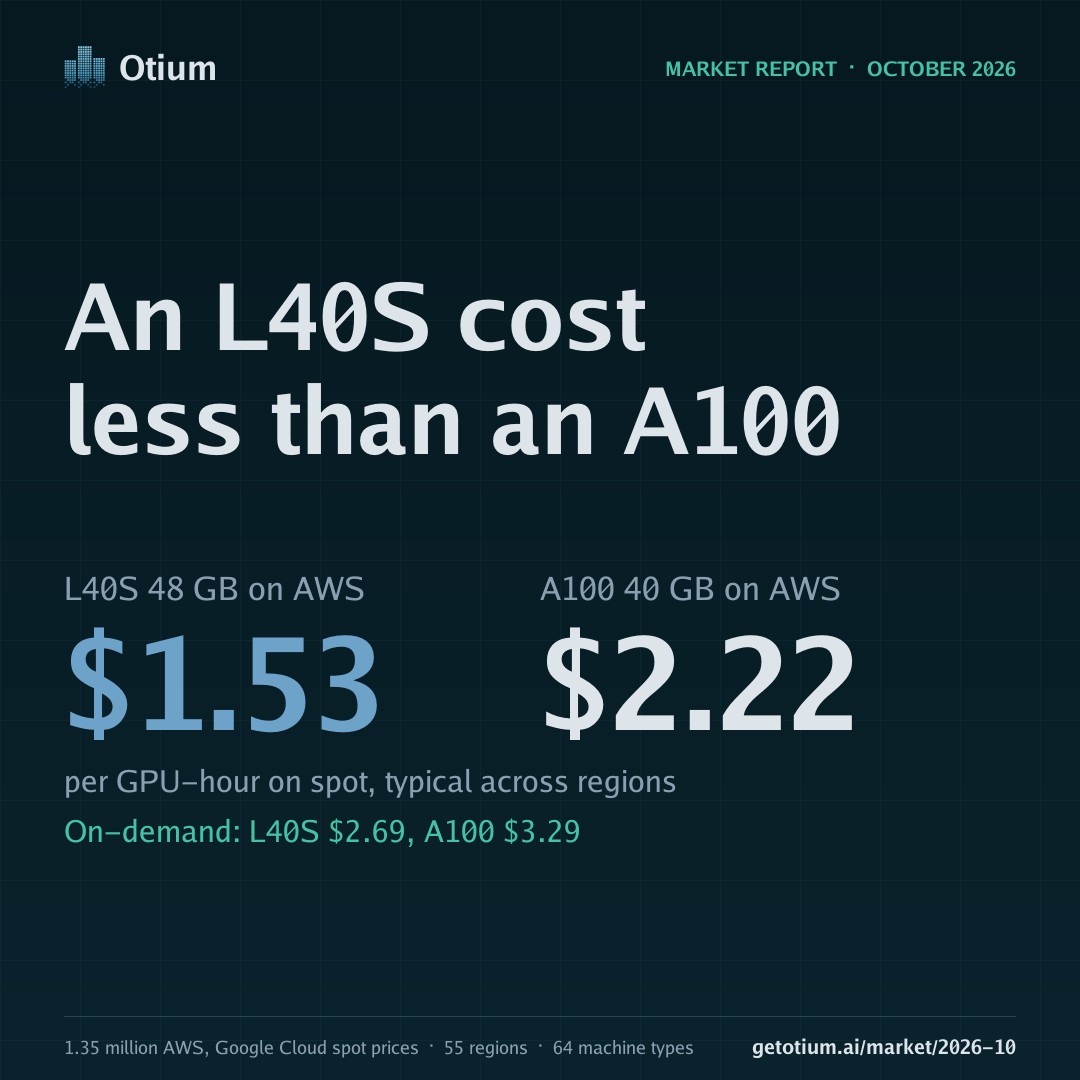
On spot, an hour on an L40S 48 GB on AWS cost $1.53, less than an hour on an A100 40 GB on AWS at $2.22. Newer and bigger is not always more expensive.
From 1.35 million spot price observations on AWS and Google Cloud, across 55 regions and 64 GPU machine types. New to spot and on-demand? Four terms, explained.
The month in brief
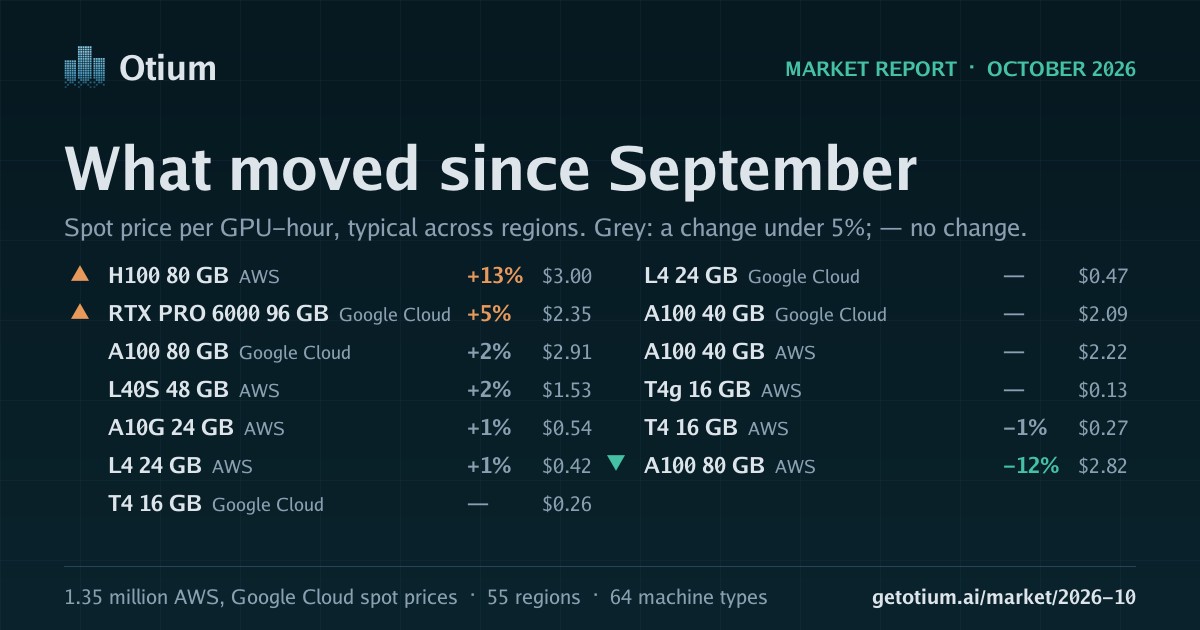
Prices held steady overall: all but three of the 13 GPUs we track moved less than 5% on spot since September. The two biggest moves went in opposite directions, both on AWS. The H100 rose 13% to $3.00 per GPU-hour and the A100 80 GB fell 12% to $2.82, so September's headline, an H100 that cost less than an A100, no longer held. The third was the RTX PRO 6000 on Google Cloud, up 5%. October's headline is an L40S, with 48 GB of memory, at $1.53 against $2.22 for an A100 with 40 GB.
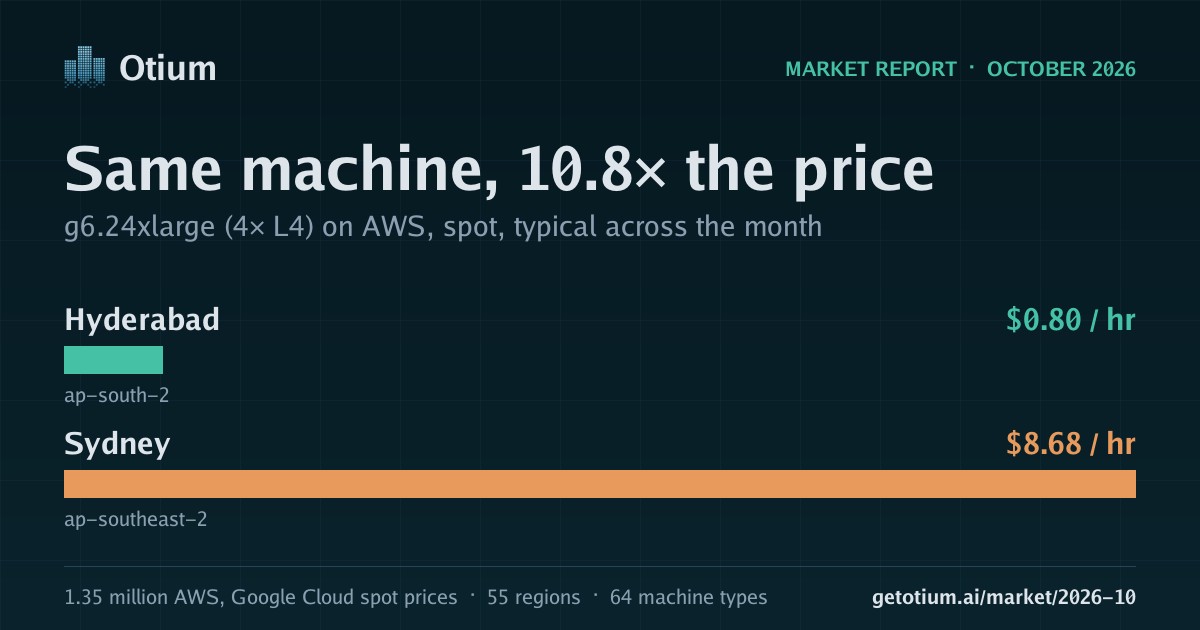
Where you rent still mattered a great deal. The same four-GPU L4 machine cost 10.8 times as much in Sydney as in Hyderabad, one of six AWS regions new to the report. Stockholm stayed the cheapest AWS region, though its prices rose 12%. This is also the first report to include Google Cloud, in 32 regions, and the two clouds priced the GPUs they both sell close together: an L4 was $0.42 on AWS and $0.47 on Google Cloud. Because of the new regions, a price here will not match the one September's report printed plus the change shown: the change compares only regions in both reports.
What stood out
- The two clouds priced the same GPU close together on spot. Of the 4 GPUs both sell, the widest gap was an L4 24 GB at $0.42 on AWS against $0.47 on Google Cloud, about 10% more.
- Where a machine runs matters: g6.24xlarge (L4, AWS) cost 10.8 times as much in Sydney (ap-southeast-2) as in Hyderabad (ap-south-2).
- Since September, H100 80 GB on AWS spot rose 13% and A100 80 GB on AWS spot fell 12%. A100 40 GB on AWS held steady at $2.22 per GPU-hour.
Spot against on-demand, per GPU-hour
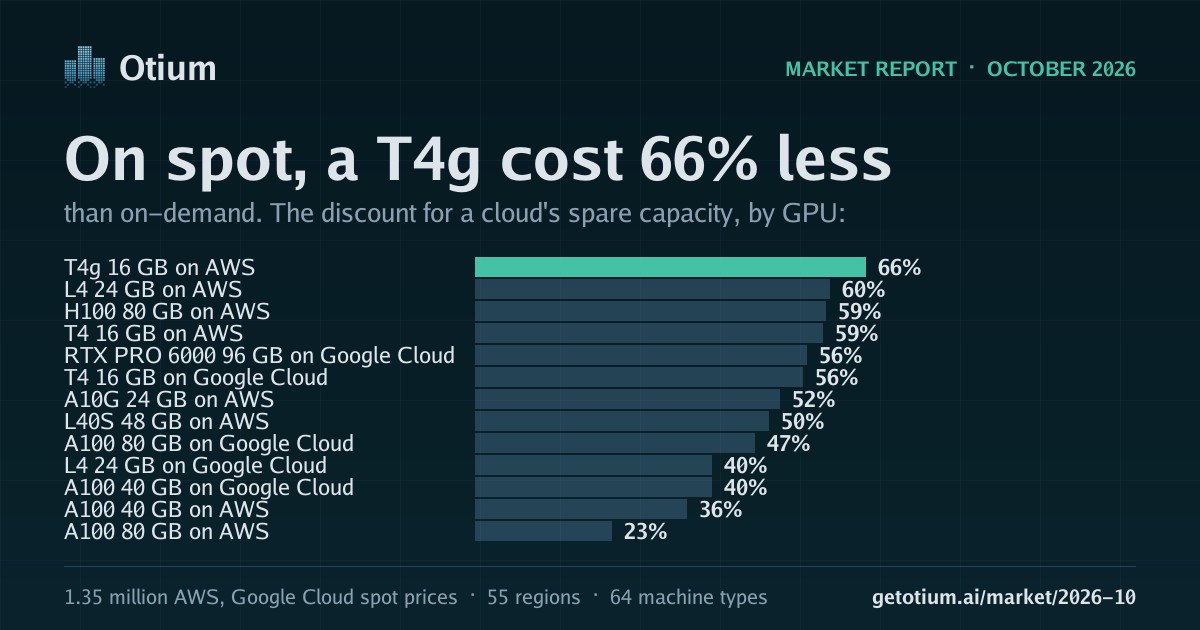
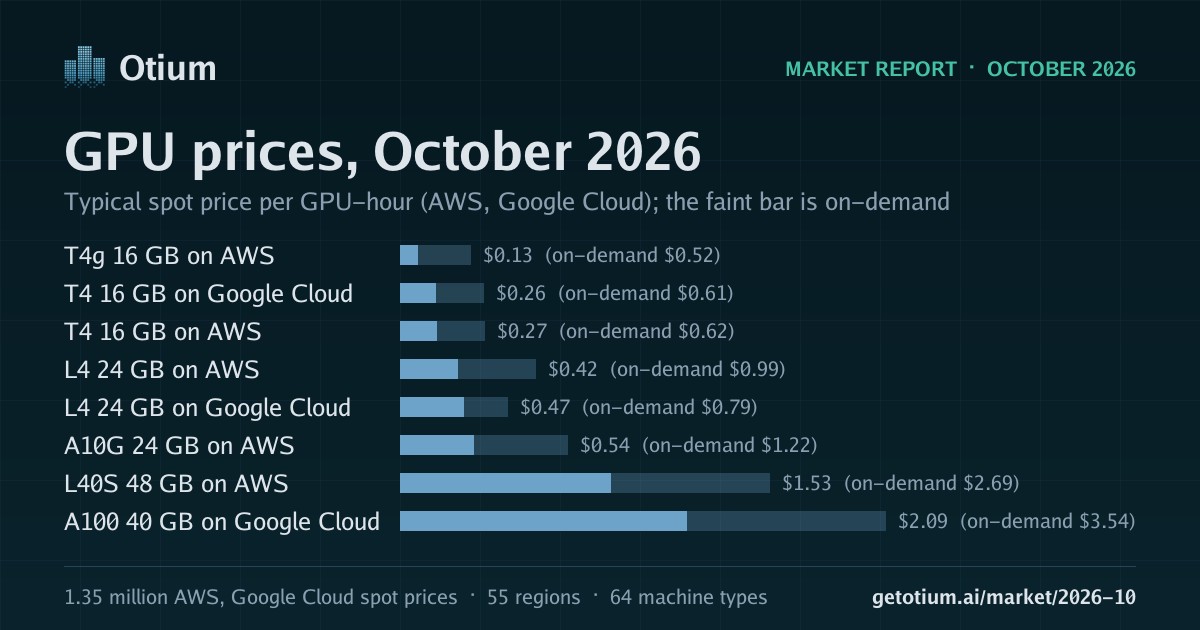
The cheapest machine for each GPU, median across regions. The gap between the two bars is the discount for using spare capacity. The discount we quote is the typical discount within a region, so it will not match dividing these two typical prices by each other.
- T4g 16 GB on AWS $0.13 $0.52
- T4 16 GB on Google Cloud $0.26 $0.61
- T4 16 GB on AWS $0.27 $0.62
- L4 24 GB on AWS $0.42 $0.99
- L4 24 GB on Google Cloud $0.47 $0.79
- A10G 24 GB on AWS $0.54 $1.22
- L40S 48 GB on AWS $1.53 $2.69
- A100 40 GB on Google Cloud $2.09 $3.54
- A100 40 GB on AWS $2.22 $3.29
- RTX PRO 6000 96 GB on Google Cloud $2.35 $5.17
- A100 80 GB on AWS $2.82 $4.12
- A100 80 GB on Google Cloud $2.91 $5.54
- H100 80 GB on AWS $3.00 $8.60
Price per GPU-hour, by GPU
Each row shows the machine type that was cheapest per GPU. Prices are the median across the regions that offered it. “Per GB” divides the spot price by the GPU’s memory: the fair comparison when what you need is room to fit a large model.
This report covers 6 more AWS regions than September’s. A price here is typical across every region we recorded this month, so it will not match the price September’s report printed plus the change shown. The change compares only regions in both reports.
| GPU | Spot / GPU-hr | Spot per GB / hr | On-demand / GPU-hr | Spot discount | Daily swing | vs September 2026 |
|---|---|---|---|---|---|---|
| T4g 16 GB on AWS g5g.xlarge | $0.13 | $0.008 | $0.52 | 66% | 2.8% | 0% |
| T4 16 GB on Google Cloud n1-standard-4 | $0.26 | $0.017 | $0.61 | 56% | 2.8% | 0% |
| T4 16 GB on AWS g4dn.xlarge | $0.27 | $0.017 | $0.62 | 59% | 5.0% | −1% |
| L4 24 GB on AWS g6.xlarge | $0.42 | $0.018 | $0.99 | 60% | 6.2% | +1% |
| L4 24 GB on Google Cloud g2-standard-4 | $0.47 | $0.019 | $0.79 | 40% | 2.0% | 0% |
| A10G 24 GB on AWS g5.xlarge | $0.54 | $0.023 | $1.22 | 52% | 8.6% | +1% |
| L40S 48 GB on AWS g6e.2xlarge | $1.53 | $0.032 | $2.69 | 50% | 11.9% | +2% |
| A100 40 GB on Google Cloud a2-megagpu-16g | $2.09 | $0.052 | $3.54 | 40% | 2.0% | 0% |
| A100 40 GB on AWS p4d.24xlarge | $2.22 | $0.056 | $3.29 | 36% | 6.0% | 0% |
| RTX PRO 6000 96 GB on Google Cloud g4-standard-192 | $2.35 | $0.025 | $5.17 | 56% | 3.8% | +5% |
| A100 80 GB on AWS p4de.24xlarge | $2.82 | $0.035 | $4.12 | 23% | 5.8% | −12% |
| A100 80 GB on Google Cloud a2-ultragpu-1g | $2.91 | $0.036 | $5.54 | 47% | 1.2% | +2% |
| H100 80 GB on AWS p5.48xlarge | $3.00 | $0.038 | $8.60 | 59% | 12.1% | +13% |
Cheapest and most expensive regions
Each region is compared machine by machine: its price for each machine against that machine’s typical price across all regions. So a region is not called cheap just because it only sells small GPUs. Regions with fewer than five machine types are left out. The last two columns show where a region broke from its overall rank.“vs September 2026” is how a region’s prices moved since then, each machine against its own price there a month before; a dash means too few of its machines were on sale in both months to say.
| Region | Cloud | vs typical | Machines compared | vs September 2026 | Best deal there | Worst deal there |
|---|---|---|---|---|---|---|
| Stockholm eu-north-1 | AWS | −48% | 34 | +12% | 8× A10G −74% g5.48xlarge | 4× L40S +21% g6e.12xlarge |
| Hyderabad ap-south-2 | AWS | −44% | 16 | — | 4× L4 −73% g6.24xlarge | 1× L4 +119% g6.4xlarge |
| Milan eu-south-1 | AWS | −38% | 7 | — | 1× T4 −61% g4dn.8xlarge | 4× T4 +44% g4dn.12xlarge |
| São Paulo sa-east-1 | AWS | −37% | 26 | +1% | 1× T4 −64% g4dn.xlarge | 8× H100 +229% p5.48xlarge |
| Spain eu-south-2 | AWS | −29% | 30 | — | 1× T4g −77% g5g.8xlarge | 1× A10G +94% g5.4xlarge |
| Paris eu-west-3 | AWS | −24% | 22 | −2% | 1× T4 −51% g4dn.8xlarge | 4× A10G +38% g5.12xlarge |
| Zurich eu-central-2 | AWS | −17% | 8 | — | 4× L4 −34% g6.12xlarge | 1× L4 −1% g6.16xlarge |
| Osaka ap-northeast-3 | AWS | −8% | 15 | −0% | 1× T4 −32% g4dn.8xlarge | 4× L40S +32% g6e.24xlarge |
| London eu-west-2 | AWS | −7% | 26 | 0% | 8× L4 −64% g6.48xlarge | 1× H100 +162% p5.4xlarge |
| Jakarta ap-southeast-3 | AWS | −3% | 11 | — | 1× A10G −74% g5.xlarge | 8× H100 +114% p5.48xlarge |
| Mumbai ap-south-1 | AWS | −1% | 34 | +9% | 4× L40S −45% g6e.12xlarge | 4× L4 +168% g6.24xlarge |
| Ohio us-east-2 | AWS | −1% | 34 | 0% | 8× A100 −58% p4d.24xlarge | 1× T4 +42% g4dn.16xlarge |
| Malaysia ap-southeast-5 | AWS | 0% | 8 | — | 8× L4 −75% g6.48xlarge | 1× L4 +12% g6.2xlarge |
| N. Virginia us-east-1 | AWS | 0% | 41 | −3% | 8× A10G −56% g5.48xlarge | 1× L4 +90% g6.2xlarge |
| Oregon us-west-2 | AWS | 0% | 41 | +2% | 8× A10G −57% g5.48xlarge | 1× L40S +70% g6e.4xlarge |
| Ireland eu-west-1 | AWS | +9% | 16 | −1% | 8× A10G −67% g5.48xlarge | 1× A10G +54% g5.8xlarge |
| Frankfurt eu-central-1 | AWS | +13% | 39 | +1% | 1× L40S −39% g6e.4xlarge | 2× T4g +93% g5g.16xlarge |
| Seoul ap-northeast-2 | AWS | +14% | 39 | 0% | 8× A100 −50% p4d.24xlarge | 2× T4g +81% g5g.metal |
| Montréal ca-central-1 | AWS | +17% | 24 | 0% | 8× A100 −40% p4d.24xlarge | 1× L4 +190% g6.16xlarge |
| Singapore ap-southeast-1 | AWS | +20% | 14 | 0% | 2× T4g −22% g5g.16xlarge | 1× T4g +79% g5g.xlarge |
| N. California us-west-1 | AWS | +20% | 8 | +1% | 8× H100 −17% p5.48xlarge | 1× T4 +60% g4dn.4xlarge |
| Sydney ap-southeast-2 | AWS | +25% | 25 | −1% | 1× A10G −20% g5.8xlarge | 4× L4 +190% g6.24xlarge |
| Tokyo ap-northeast-1 | AWS | +37% | 41 | 0% | 4× L40S −33% g6e.24xlarge | 4× A10G +114% g5.24xlarge |
| Seoul asia-northeast3 | Google Cloud | −27% | 14 | +10% | 1× L4 −27% g2-standard-32 | 4× T4 +30% n1-standard-32 |
| Mumbai asia-south1 | Google Cloud | −20% | 14 | 0% | 1× L4 −20% g2-standard-8 | 4× RTX PRO 6000 +7% g4-standard-192 |
| N. Virginia us-east4 | Google Cloud | −19% | 18 | 0% | 1× RTX PRO 6000 −20% g4-standard-48 | 1× T4 +6% n1-standard-4 |
| Columbus us-east5 | Google Cloud | −14% | 8 | +7% | 2× A100 −35% a2-ultragpu-2g | 4× RTX PRO 6000 +7% g4-standard-192 |
| Iowa us-central1 | Google Cloud | −9% | 23 | 0% | 1× RTX PRO 6000 −28% g4-standard-48 | 1× T4 +18% n1-standard-4 |
| South Carolina us-east1 | Google Cloud | −9% | 18 | 0% | 1× RTX PRO 6000 −25% g4-standard-48 | 1× T4 +18% n1-standard-4 |
| Oregon us-west1 | Google Cloud | −9% | 18 | 0% | 1× RTX PRO 6000 −25% g4-standard-48 | 1× T4 +18% n1-standard-4 |
| Salt Lake City us-west3 | Google Cloud | −8% | 10 | −1% | 1× T4 −30% n1-standard-4 | 1× A100 +12% a2-highgpu-1g |
| Netherlands europe-west4 | Google Cloud | −4% | 23 | 0% | 4× A100 −8% a2-highgpu-4g | 1× T4 +26% n1-standard-4 |
| Montréal northamerica-northeast1 | Google Cloud | 0% | 10 | 0% | 1× L4 0% g2-standard-32 | 4× T4 +7% n1-standard-32 |
| Toronto northamerica-northeast2 | Google Cloud | 0% | 8 | 0% | 1× L4 0% g2-standard-32 | 1× L4 0% g2-standard-4 |
| Belgium europe-west1 | Google Cloud | 0% | 14 | +8% | 1× T4 −7% n1-standard-4 | 1× L4 0% g2-standard-4 |
| Las Vegas us-west4 | Google Cloud | +2% | 18 | +6% | 4× A100 −3% a2-highgpu-4g | 4× RTX PRO 6000 +4% g4-standard-192 |
| London europe-west2 | Google Cloud | +4% | 14 | 0% | 1× T4 −9% n1-standard-4 | 1× L4 +4% g2-standard-4 |
| Tokyo asia-northeast1 | Google Cloud | +4% | 18 | −4% | 1× RTX PRO 6000 −4% g4-standard-48 | 1× L4 +11% g2-standard-4 |
| Tel Aviv me-west1 | Google Cloud | +4% | 6 | 0% | 1× T4 −10% n1-standard-4 | 1× A100 +4% a2-highgpu-1g |
| Taiwan asia-east1 | Google Cloud | +5% | 14 | +5% | 4× T4 −16% n1-standard-32 | 4× RTX PRO 6000 +16% g4-standard-192 |
| Frankfurt europe-west3 | Google Cloud | +7% | 10 | 0% | 1× L4 +7% g2-standard-8 | 4× T4 +30% n1-standard-32 |
| São Paulo southamerica-east1 | Google Cloud | +9% | 6 | — | 1× RTX PRO 6000 +9% g4-standard-48 | 1× T4 +44% n1-standard-4 |
| Singapore asia-southeast1 | Google Cloud | +12% | 23 | 0% | 4× T4 −37% n1-standard-32 | 1× A100 +23% a2-ultragpu-1g |
| Jakarta asia-southeast2 | Google Cloud | +12% | 6 | +5% | 4× T4 −51% n1-standard-32 | 4× RTX PRO 6000 +12% g4-standard-192 |
| Zurich europe-west6 | Google Cloud | +23% | 8 | 0% | 1× L4 +21% g2-standard-32 | 1× L4 +25% g2-standard-4 |
| Dammam me-central2 | Google Cloud | +37% | 12 | −0% | 1× RTX PRO 6000 +5% g4-standard-48 | 1× L4 +37% g2-standard-32 |
Capturing gaps like these means running in many regions at once: moving your data, getting GPU quota in each, and shifting work when capacity disappears. That is the plumbing Otium is being built to handle, so your team doesn’t have to. Create an account
Every machine type
Hourly prices for the whole machine. “Region gap” is how many times as much the most expensive region charged as the cheapest, for the same machine.
| Machine | GPUs | Spot | On-demand | Discount | Cheapest region | Region gap | Regions | vs September 2026 |
|---|---|---|---|---|---|---|---|---|
| g5g.xlarge | 1× T4g 16 GB | $0.133 | $0.517 | 68% | Frankfurt eu-central-1 | 2.4× | 7 | −3% |
| n1-standard-4 | 1× T4 16 GB | $0.265 | $0.614 | 56% | Jakarta asia-southeast2 | 2.6× | 23 | 0% |
| g4dn.xlarge | 1× T4 16 GB | $0.271 | $0.616 | 55% | São Paulo sa-east-1 | 3.7× | 18 | −1% |
| g5g.2xlarge | 1× T4g 16 GB | $0.289 | $0.684 | 54% | Spain eu-south-2 | 2.9× | 7 | 0% |
| g4dn.2xlarge | 1× T4 16 GB | $0.320 | $0.880 | 58% | Stockholm eu-north-1 | 4.2× | 18 | −1% |
| n1-standard-32 | 4× T4 16 GB | $1.457 | $3.430 | 56% | Jakarta asia-southeast2 | 2.8× | 23 | 0% |
| g5g.4xlarge | 1× T4g 16 GB | $0.365 | $1.018 | 64% | Spain eu-south-2 | 5.5× | 7 | −1% |
| g5g.metal | 2× T4g 16 GB | $0.839 | $3.404 | 74% | Spain eu-south-2 | 4.9× | 8 | +5% |
| g6.xlarge | 1× L4 24 GB | $0.425 | $0.990 | 53% | Stockholm eu-north-1 | 3.4× | 17 | −2% |
| g5g.16xlarge | 2× T4g 16 GB | $0.879 | $3.375 | 68% | Spain eu-south-2 | 5.5× | 7 | −0% |
| g2-standard-4 | 1× L4 24 GB | $0.466 | $0.787 | 40% | Seoul asia-northeast3 | 1.9× | 18 | 0% |
| g4dn.12xlarge | 4× T4 16 GB | $1.897 | $4.579 | 59% | Stockholm eu-north-1 | 2.1× | 18 | −1% |
| g6.2xlarge | 1× L4 24 GB | $0.480 | $1.202 | 57% | Stockholm eu-north-1 | 5.7× | 17 | +2% |
| g4dn.4xlarge | 1× T4 16 GB | $0.520 | $1.409 | 61% | São Paulo sa-east-1 | 3.5× | 18 | −1% |
| g4dn.metal | 8× T4 16 GB | $4.221 | $9.157 | 55% | London eu-west-2 | 2.6× | 18 | +2% |
| g5.xlarge | 1× A10G 24 GB | $0.542 | $1.222 | 52% | Jakarta ap-southeast-3 | 5.2× | 16 | +1% |
| g2-standard-8 | 1× L4 24 GB | $0.563 | $0.951 | 40% | Seoul asia-northeast3 | 1.9× | 18 | 0% |
| g6.4xlarge | 1× L4 24 GB | $0.574 | $1.627 | 66% | Stockholm eu-north-1 | 6.6× | 17 | +1% |
| g2-standard-12 | 1× L4 24 GB | $0.660 | $1.114 | 40% | Seoul asia-northeast3 | 1.9× | 18 | 0% |
| g2-standard-48 | 4× L4 24 GB | $2.640 | $4.457 | 40% | Seoul asia-northeast3 | 1.9× | 18 | 0% |
| g2-standard-96 | 8× L4 24 GB | $5.280 | $8.913 | 40% | Seoul asia-northeast3 | 1.9× | 18 | 0% |
| g2-standard-24 | 2× L4 24 GB | $1.320 | $2.228 | 40% | Seoul asia-northeast3 | 1.9× | 18 | 0% |
| g5g.8xlarge | 1× T4g 16 GB | $0.682 | $1.688 | 62% | Spain eu-south-2 | 5.5× | 7 | 0% |
| g5.2xlarge | 1× A10G 24 GB | $0.690 | $1.473 | 53% | Stockholm eu-north-1 | 3.6× | 16 | +2% |
| g6.12xlarge | 4× L4 24 GB | $2.766 | $5.658 | 53% | São Paulo sa-east-1 | 4.6× | 17 | +5% |
| g6.24xlarge | 4× L4 24 GB | $2.990 | $8.208 | 64% | Hyderabad ap-south-2 | 10.8× | 17 | 0% |
| g2-standard-16 | 1× L4 24 GB | $0.757 | $1.278 | 40% | Seoul asia-northeast3 | 1.9× | 18 | 0% |
| g4dn.8xlarge | 1× T4 16 GB | $0.797 | $2.546 | 66% | Milan eu-south-1 | 4.5× | 18 | 0% |
| g6.48xlarge | 8× L4 24 GB | $6.809 | $16.416 | 55% | Malaysia ap-southeast-5 | 10.3× | 17 | 0% |
| g5.4xlarge | 1× A10G 24 GB | $0.872 | $1.974 | 51% | Stockholm eu-north-1 | 4.0× | 16 | +1% |
| g6.8xlarge | 1× L4 24 GB | $0.907 | $2.477 | 64% | Spain eu-south-2 | 5.3× | 17 | +1% |
| g5.12xlarge | 4× A10G 24 GB | $4.504 | $6.893 | 34% | Stockholm eu-north-1 | 5.0× | 16 | +3% |
| g2-standard-32 | 1× L4 24 GB | $1.144 | $1.932 | 40% | Seoul asia-northeast3 | 1.9× | 18 | 0% |
| g5.8xlarge | 1× A10G 24 GB | $1.207 | $2.975 | 56% | Jakarta ap-southeast-3 | 5.5× | 16 | −1% |
| g5.24xlarge | 4× A10G 24 GB | $4.980 | $9.779 | 45% | Stockholm eu-north-1 | 5.0× | 13 | 0% |
| g6.16xlarge | 1× L4 24 GB | $1.299 | $4.177 | 67% | Hyderabad ap-south-2 | 8.1× | 17 | 0% |
| g4dn.16xlarge | 1× T4 16 GB | $1.450 | $5.093 | 72% | São Paulo sa-east-1 | 3.6× | 18 | +1% |
| g6e.2xlarge | 1× L40S 48 GB | $1.534 | $2.693 | 50% | Hyderabad ap-south-2 | 2.9× | 11 | +16% |
| g6e.xlarge | 1× L40S 48 GB | $1.572 | $2.235 | 22% | Hyderabad ap-south-2 | 2.9× | 11 | +2% |
| g6e.4xlarge | 1× L40S 48 GB | $1.770 | $3.608 | 52% | Stockholm eu-north-1 | 2.8× | 11 | +1% |
| g6e.12xlarge | 4× L40S 48 GB | $7.144 | $12.601 | 50% | Hyderabad ap-south-2 | 3.7× | 11 | +2% |
| g5.48xlarge | 8× A10G 24 GB | $16.357 | $19.793 | 18% | Stockholm eu-north-1 | 5.6× | 16 | 0% |
| a2-megagpu-16g | 16× A100 40 GB | $33.443 | $56.627 | 40% | Netherlands europe-west4 | 1.1× | 3 | 0% |
| p4d.24xlarge | 8× A100 40 GB | $17.797 | $26.344 | 36% | Stockholm eu-north-1 | 4.6× | 13 | 0% |
| g6e.8xlarge | 1× L40S 48 GB | $2.239 | $5.439 | 59% | Stockholm eu-north-1 | 2.8× | 11 | 0% |
| g5.16xlarge | 1× A10G 24 GB | $2.255 | $4.978 | 56% | Stockholm eu-north-1 | 9.3× | 16 | +1% |
| a2-highgpu-1g | 1× A100 40 GB | $2.322 | $3.974 | 40% | Netherlands europe-west4 | 1.2× | 10 | 0% |
| a2-highgpu-2g | 2× A100 40 GB | $4.645 | $7.948 | 40% | Netherlands europe-west4 | 1.2× | 10 | 0% |
| a2-highgpu-4g | 4× A100 40 GB | $9.290 | $15.896 | 40% | Netherlands europe-west4 | 1.2× | 10 | 0% |
| a2-highgpu-8g | 8× A100 40 GB | $18.579 | $31.793 | 40% | Netherlands europe-west4 | 1.2× | 10 | 0% |
| g4-standard-192 | 4× RTX PRO 6000 96 GB | $9.416 | $20.698 | 56% | Iowa us-central1 | 1.6× | 22 | +5% |
| g4-standard-384 | 8× RTX PRO 6000 96 GB | $18.832 | $41.396 | 56% | Iowa us-central1 | 1.6× | 22 | +5% |
| g4-standard-48 | 1× RTX PRO 6000 96 GB | $2.354 | $5.175 | 56% | Iowa us-central1 | 1.6× | 22 | +5% |
| g4-standard-96 | 2× RTX PRO 6000 96 GB | $4.708 | $10.349 | 56% | Iowa us-central1 | 1.6× | 22 | +5% |
| p4de.24xlarge | 8× A100 80 GB | $22.544 | $32.937 | 23% | Oregon us-west-2 | 1.7× | 5 | −12% |
| a2-ultragpu-1g | 1× A100 80 GB | $2.912 | $5.536 | 47% | Columbus us-east5 | 1.9× | 5 | +2% |
| a2-ultragpu-8g | 8× A100 80 GB | $23.295 | $44.286 | 47% | Columbus us-east5 | 1.9× | 5 | +2% |
| a2-ultragpu-2g | 2× A100 80 GB | $5.824 | $11.071 | 47% | Columbus us-east5 | 1.9× | 5 | +2% |
| a2-ultragpu-4g | 4× A100 80 GB | $11.647 | $22.143 | 47% | Columbus us-east5 | 1.9× | 5 | +2% |
| p5.48xlarge | 8× H100 80 GB | $24.027 | $68.800 | 63% | Montréal ca-central-1 | 4.6× | 13 | +10% |
| g6e.16xlarge | 1× L40S 48 GB | $3.153 | $9.100 | 65% | Hyderabad ap-south-2 | 4.3× | 11 | 0% |
| g6e.48xlarge | 8× L40S 48 GB | $25.583 | $36.187 | 21% | Seoul ap-northeast-2 | 2.1× | 11 | +3% |
| p5.4xlarge | 1× H100 80 GB | $3.416 | $8.428 | 56% | Stockholm eu-north-1 | 5.8× | 10 | +17% |
| g6e.24xlarge | 4× L40S 48 GB | $14.726 | $18.093 | 11% | Hyderabad ap-south-2 | 4.2× | 11 | +5% |
Renting against owning a GPU
Owning a card means paying for it once, then for its electricity. Renting means paying by the hour. In October, running an RTX 3090 cost about 6¢ an hour in electricity at the US average home rate, and renting a machine with the same 24 GB of GPU memory cost about 99¢ an hour on-demand: 93¢ an hour more. So each $1,000 you would spend on the card pays for about 1,100 hours of renting instead, about 40 days around the clock.
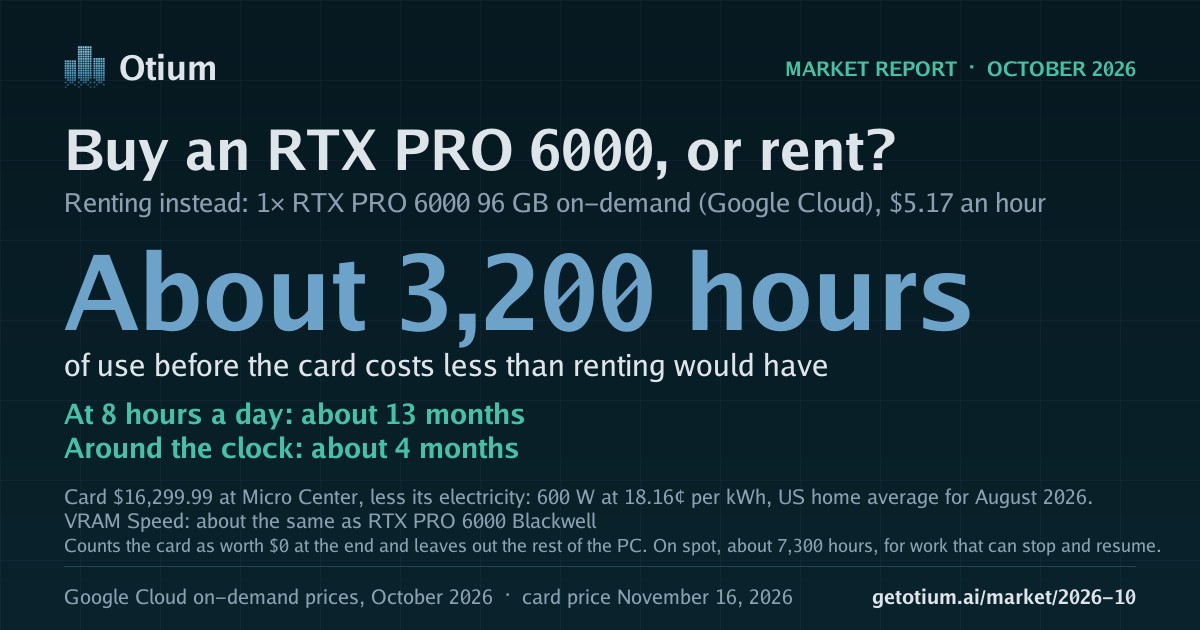
Whether buying is worth it comes down to two things only you know: what the card would cost you, and how many hours a day you would use it. Put in a price and the table works out the break-even, how long you would need to use the card before it has cost you less than renting.
It counts the card as worth nothing at the end. If you expect to sell it, take what you would get off the price you put in. The rest of the computer is not in the sum, and on spot the hours roughly double, for work that can stop and resume.
Spot is cheaper, if your work can stop and resume: the cloud can take it back at short notice.
| Your own GPU | Its electricity | Renting the same memory | Extra to rent, per hour | What the card costs you | Break-even |
|---|---|---|---|---|---|
| RTX 3090 24 GB · up to 350 W · 936 GB/s | $0.064/hr | $0.990/hr 1× L4 24 GB · g6.xlarge on AWS VRAM Speed: ~3x slower than RTX 3090 | $0.926/hr | 1,100 hours to pay off each $1,000 of card | |
| RTX 4090 24 GB · up to 450 W · 1,008 GB/s | $0.082/hr | $0.990/hr 1× L4 24 GB · g6.xlarge on AWS VRAM Speed: ~3x slower than RTX 4090 | $0.908/hr | 1,100 hours to pay off each $1,000 of card | |
| RTX 5090 32 GB · up to 575 W · 1,792 GB/s | $0.104/hr | $2.693/hr 1× L40S 48 GB · g6e.2xlarge on AWS Not exact: the nearest size rented has 48 GB VRAM Speed: ~2.1x slower than RTX 5090 | $2.588/hr | 390 hours to pay off each $1,000 of card | |
| 2× RTX 3090 48 GB · up to 700 W · 1,872 GB/s | $0.127/hr | $2.693/hr 1× L40S 48 GB · g6e.2xlarge on AWS VRAM Speed: ~2.2x slower than 2× RTX 3090 | $2.566/hr | 390 hours to pay off each $1,000 of card | |
| RTX 6000 Ada 48 GB · up to 300 W · 960 GB/s | $0.054/hr | $2.693/hr 1× L40S 48 GB · g6e.2xlarge on AWS VRAM Speed: about the same as RTX 6000 Ada | $2.638/hr | 380 hours to pay off each $1,000 of card | |
| RTX PRO 6000 Blackwell 96 GB · up to 600 W · 1,792 GB/s | $0.109/hr | $5.175/hr 1× RTX PRO 6000 96 GB · g4-standard-48 on Google Cloud VRAM Speed: about the same as RTX PRO 6000 Blackwell | $5.066/hr | 200 hours to pay off each $1,000 of card | |
| ASUS Ascent GX10 128 GB · up to 240 W · 273 GB/s A whole computer, not a card | $0.044/hr | $10.349/hr 2× RTX PRO 6000 96 GB · g4-standard-96 on Google Cloud Not exact: 2 GPUs together hold 192 GB VRAM Speed: ~12x faster than ASUS Ascent GX10 | $10.305/hr | 100 hours to pay off each $1,000 of card |
How it works. The extra to rent is the rented price less the card’s electricity: what each hour of renting costs you over an hour of running your own card. The break-even is the card’s price divided by it: the hours of use before the card has paid for itself, so fewer hours is better for buying. Electricity is the US average home rate for August 2026, 18.16¢ per kWh, with each card at its maker’s rated maximum power, so a real bill is likely lower. It pairs by memory, which decides whether a model fits. Speed is the other half: each row says how fast each side reads its memory (GB/s, the makers’ figures), which for a model that fits sets how fast text comes out. Where the rented machine is many times faster, it does the same work in far fewer hours than the break-even counts. It starts from on-demand because a card you own is never taken away mid-job; spot is the fair comparison only for work that can stop and resume. The break-even leaves out the rest of the computer (except for a whole computer like the GX10), and counts the card as worth nothing at the end. More under How to read this, and the method in full in renting against owning a GPU.
How to read this
- Spot
- Spare capacity a cloud sells at a discount. The catch: it can take the machine back at short notice, so it suits work that can pause and resume.
- On-demand
- The standard price. The machine is yours until you stop it.
- GPU-hour
- One GPU for one hour. Prices are divided by the number of GPUs in a machine, so an eight-GPU server and a single card compare fairly.
- Median
- The middle value. Half the prices were lower and half higher, so one odd reading barely moves it.
A price is not a guarantee. These are the prices AWS and Google Cloud published. They do not prove a machine could actually be rented at that price. A region that looks cheap may also be one where spot machines ran out.
Where the numbers come from. We recorded spot prices at least every half hour on AWS in 23 regions, with on-demand prices in 23; at least once a day on Google Cloud in 32 regions, with on-demand prices in 32. Each figure is the median of those readings, so a brief spike barely moves it. Discounts compare spot and on-demand in the same region only: the figure is the median of each region’s own discount, which is why it differs from dividing the median spot price by the median on-demand price (the T4g 16 GB on AWS at $0.13 against $0.52 looks like 74% off, and the typical region’s discount is 66%). Changes since September compare only regions we recorded in both months, so a region we added never shows up as a price change.
Daily swing is how far a typical day’s price sat from the month’s average. Under 2% is close to flat; over 10% means the day you rent can noticeably change what you pay. Prices are for Linux, before tax. The T4g machines pair the GPU with an Arm processor.
Renting against owning. Electricity is the US average residential rate for August 2026, the latest the U.S. Energy Information Administration had published when this report was built: 18.16¢ per kWh. Rates ran from 12.72¢ in Nevada to 47.18¢ in Hawaii, so check your own bill. Each card is counted at its maker’s rated maximum power, a ceiling: running a model often draws less, and the rest of the computer adds some. The rented machine is the one with the fewest GPUs that together hold at least the card’s memory, and the lowest spot price among those. The tables print no card prices: they change weekly and differ by seller, and you know what you would pay. The buy-or-rent image in the media kit is the one exception: it carries a single retail price, with the seller and the day it was seen, so its break-even can be checked.
Dates. AWS stamps each spot price with the time it took effect. A price set before the month began and still in force is counted in the month it was set. For October 2026 that affected fewer than 1% of readings. The daily charts use the price in force at the end of each day, so a region whose price did not change still counts.
Media kit
Writing about this report? The PDF, the images, the citation and the data are free to use, with credit and a link back here.
The report as a PDF
The month in one file, to read offline, forward or attach: the findings, every table and the method. Download the PDF.
Images
Each says one finding from this report, with the figures behind it.
 The headline Download, 1200×630
 The headline, square Download, 1080×1080
 What moved Download, 1200×630
 The spot discount Download, 1200×630
 The region spread Download, 1200×630
 Every GPU Download, 1200×630
 Buy or rent Download, 1200×630
Cite this report
Otium, "AI compute market report: October 2026", getotium.ai/market/2026-10
The data
Every figure in this report, one row per machine type: download the CSV. It is licensed CC BY 4.0: use it, chart it and republish it, with credit.
Get the next report
GPU prices every month, by GPU and by region. One email a month; we’ll ask you to confirm first.
Free. One-click unsubscribe in every issue.